Revenue Bridge Analysis: The Key to Unlocking Your SaaS Growth Potential

Managing a SaaS business with a dynamic CRM pipeline is never easy. You need to continually adjust the lead gen tap; make sure you have a careful eye on churn risks whilst chasing-down growth opportunities; and fine-tune the balance between growth from existing customers and new.
But if your revenue isn’t growing as fast as you expected, your first battle is often working out what is actually going on.
Enter the world of the “Revenue Bridge” – your secret weapon for understanding the true dynamics of your SaaS growth.

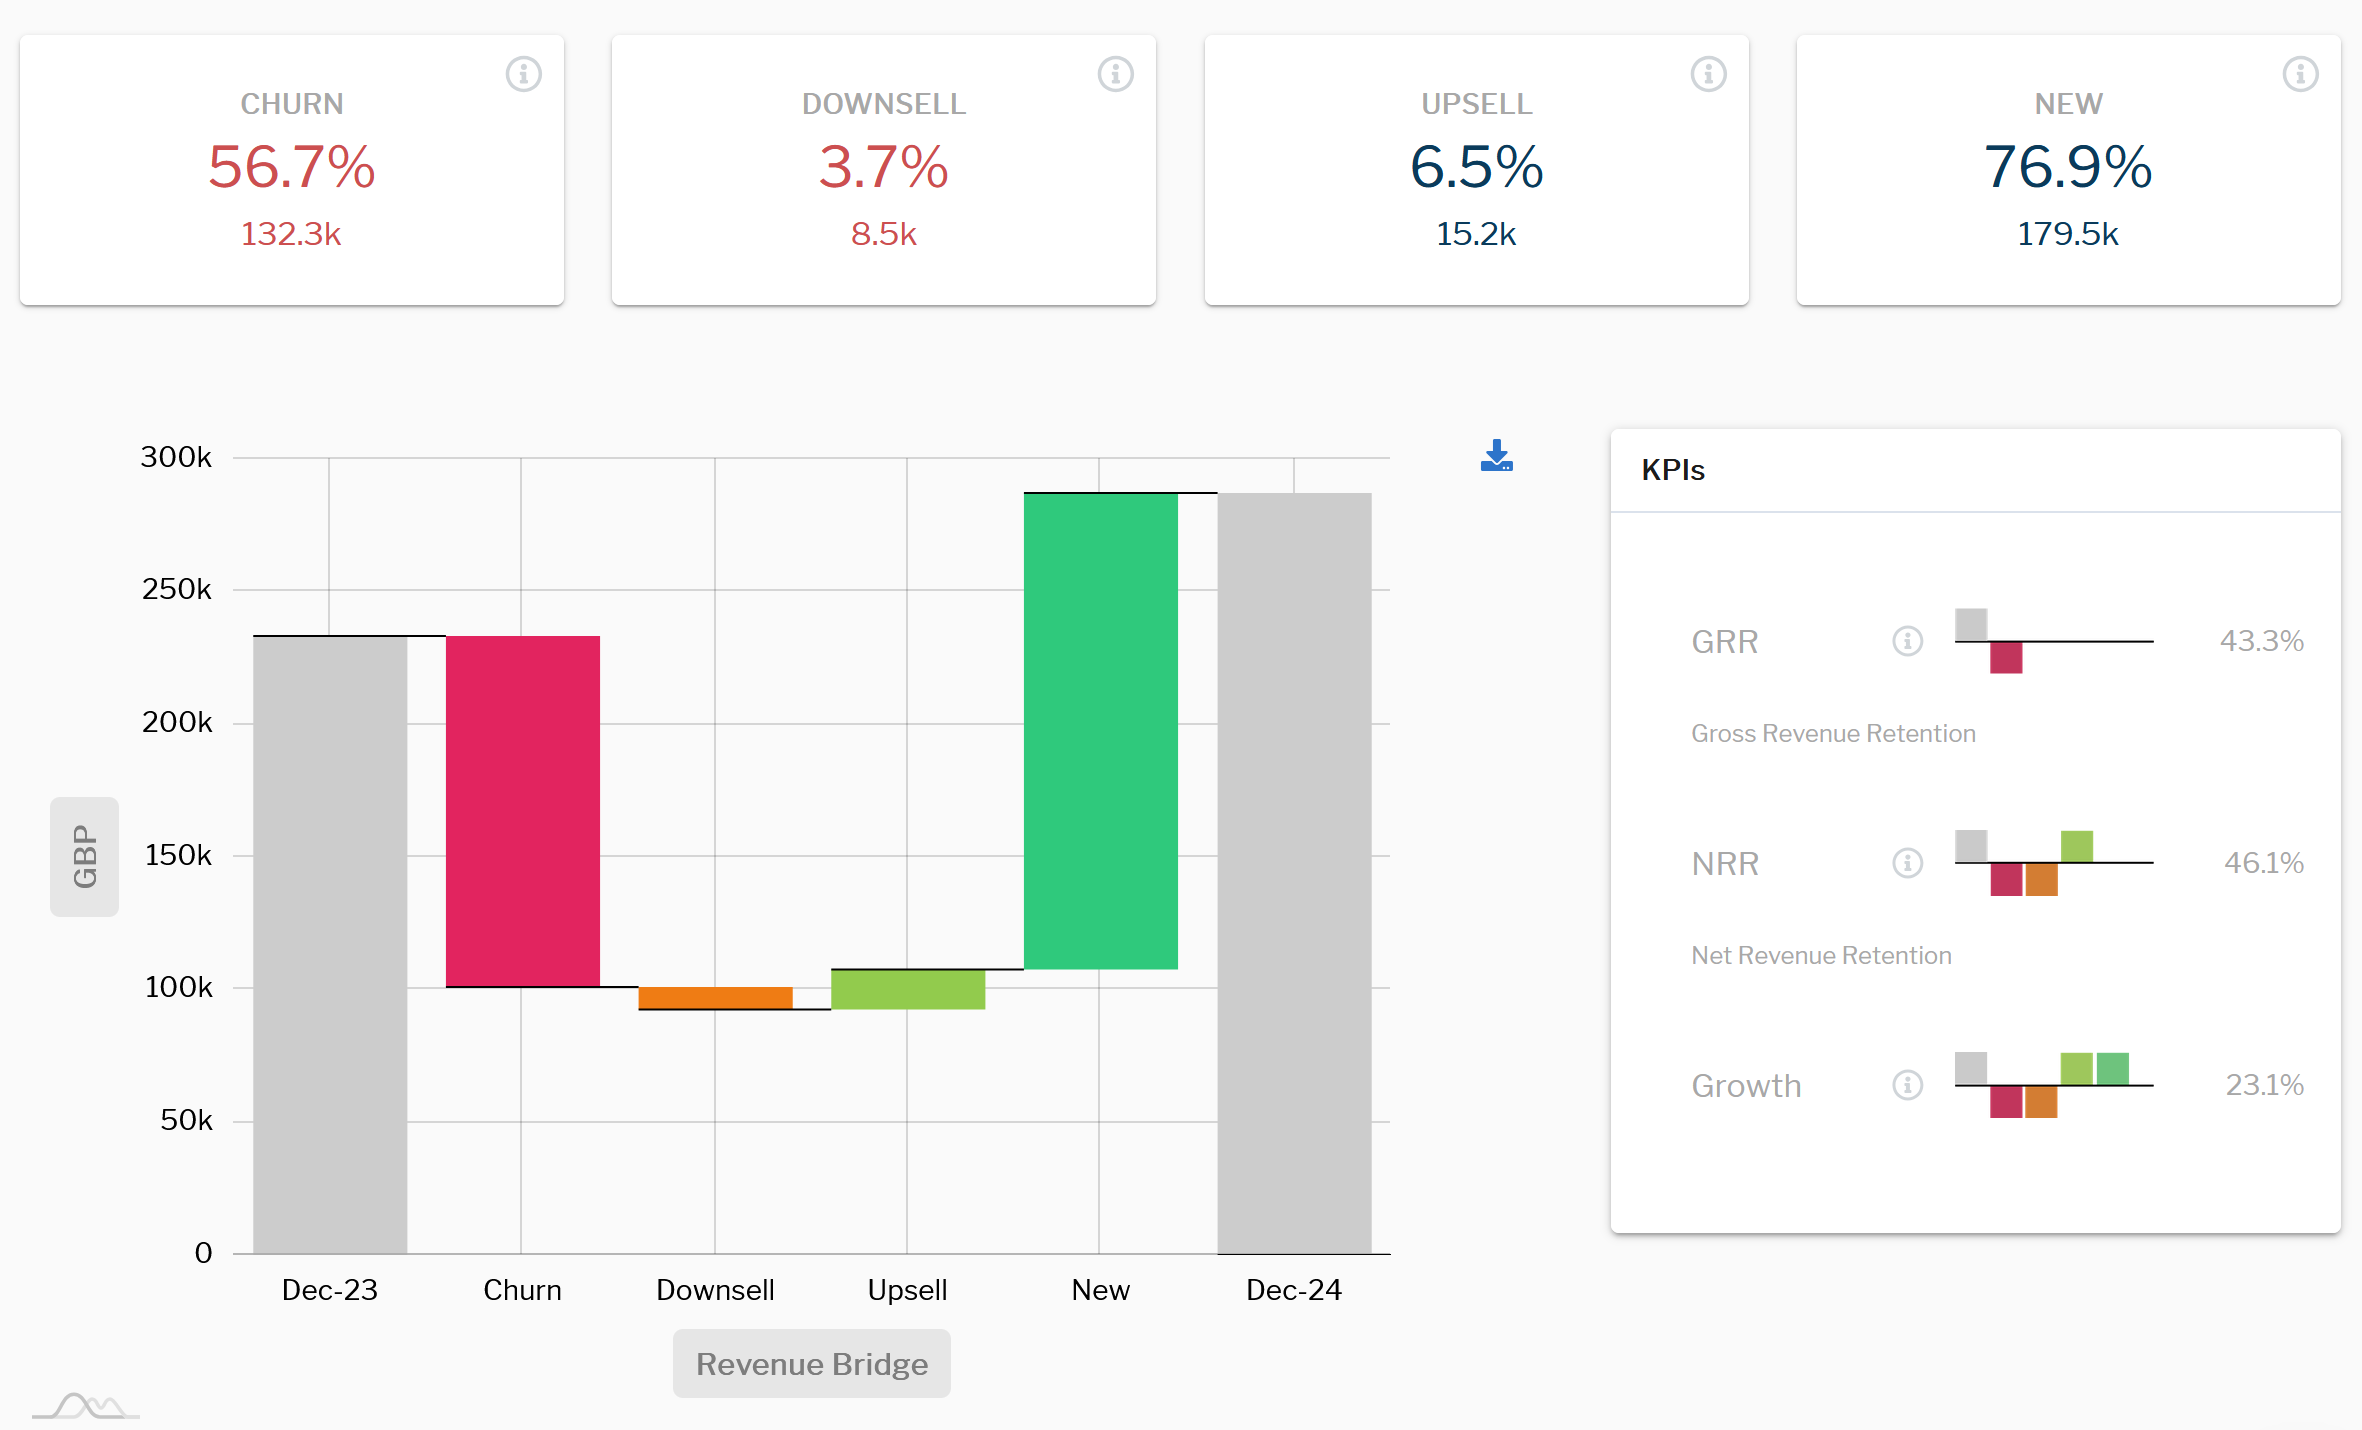
Annual revenue bridge analysis together with key performance indicators (KPIs)
What is a Revenue Bridge?
First, let’s define what we mean by a Revenue Bridge. It’s a visual representation that shows how your Monthly Recurring Revenue (MRR) or Annual Recurring Revenue (ARR) changes over time. The analysis breaks down the components that contribute to your revenue growth or decline, including new business, up-sells, down-sells and churn.
At QuarterOne, we love using Revenue Bridge charts to give customers a clear picture of how value flows from one period to another. For example, in our Revenue Bridge feature, any churn is highlighted in red, new business in green, and the total change in revenue is clearly displayed.
Why Revenue Bridge Analysis Matters
CRM software generally looks at revenue at a specific point in time. Because of this view, CRMs can often overlook the dynamic nature of SaaS revenue, which can lead to surprises when you care about sales for the month, quarter, or year.
We regularly see businesses where changes in existing customer revenue (both positive and negative) have a bigger impact on the forecast than all the new deals added together. So understanding these changes can be a big deal!
Key metrics to help fix your growth issues
To take control of your SaaS growth, you first need to measure and understand it. The revenue bridge goes a long way in achieving this.
The second step is to set KPI targets, assign these to relevant teams and track performance against these targets at least quarterly. When analyzing your Revenue Bridge, pay close attention to these key performance indicators (KPIs):
- Gross Revenue Retention (GRR): shows how well you’re retaining your existing revenue, excluding any growth from upsells.
- Net Revenue Retention (NRR): includes both retention and growth from existing customers. An NRR over 100% is a strong sign of product-market fit.
- Growth Rate: takes into account all factors and gives you your overall growth trajectory.
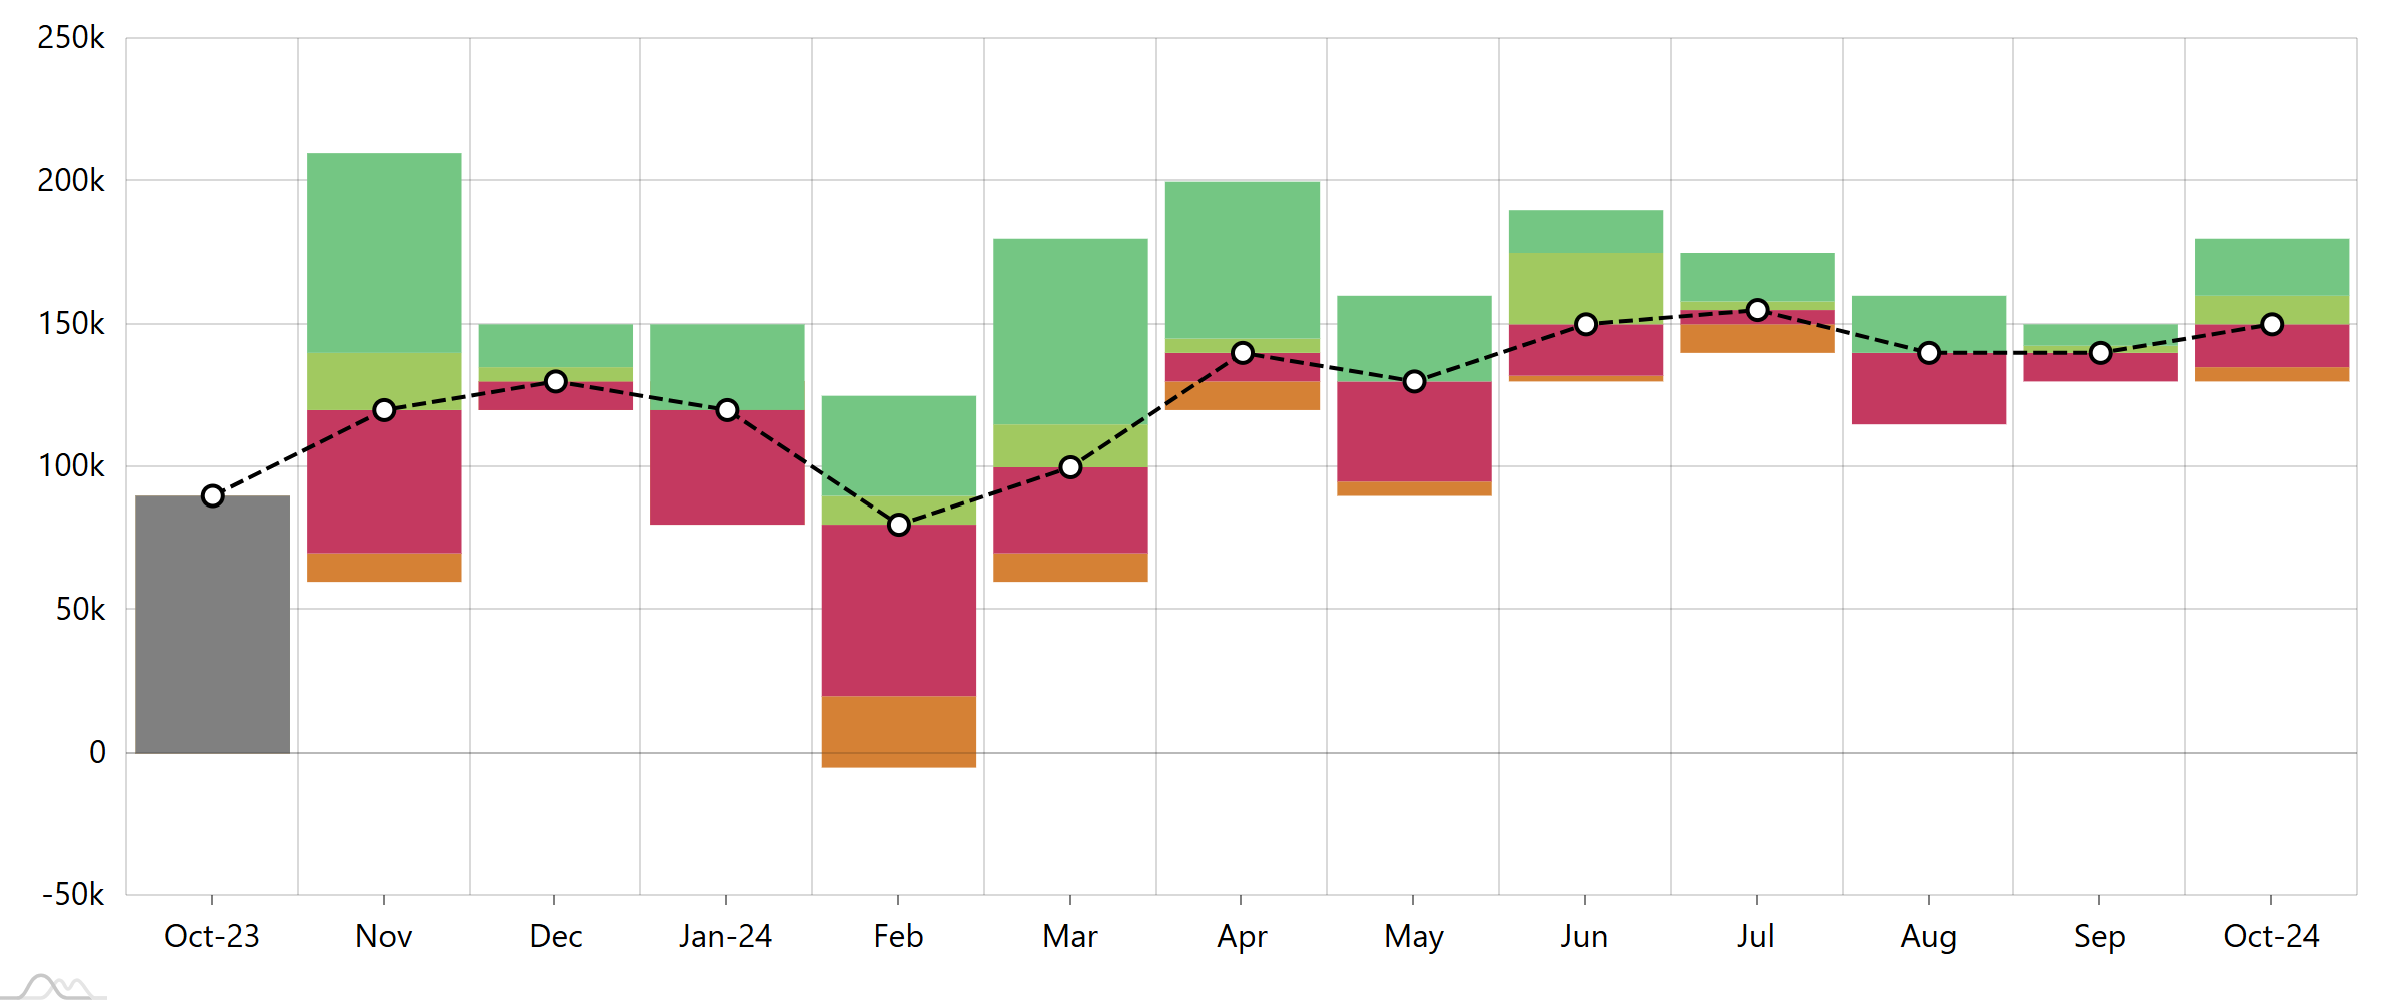
SaaS private equity investors are typically setting targets for over 60% growth per annum. But underpinning this, they will also have an eye on churn (<10% maybe), upsell (25% maybe – i.e. gross revenue retention of 125%) and net revenue retention (including churn and upsell) or over 100%. Setting annual KPI targets and measuring performance against these targets using a revenue bridge can be a valuable tool. Of course, the messy reality of month-on-month trading is perhaps one for your management team to worry about more than external investors, but a month-by-month revenue bridge can do that too…..

Month-by-month revenue bridge analysis
Once you measure it, you can control it
Once you’re able to analyze and measure your revenue changes through a Revenue Bridge, what should you do about it? We recommend a few simple steps:
- Make revenue changes visible: Share your analysis with the team. If possible, visualize revenue changes for each product or customer segment.
- Align behind KPI targets and assign responsibilities: Set and communicate your KPI targets and make sure everyone knows what they mean and who is accountable for what.
- Get your team to think in terms of revenue changes: Move away from thinking about revenue as a static number. Get everyone to start thinking about how and why revenue is changing over time.
- Build revenue change analysis into your forecast: Once you understand where and why your revenue is changing, you can make more accurate forecasts and set more realistic growth targets.
Of course, the beauty of most modern CRMs is that they should contain all the data you need to track your SaaS pipeline changes. We’ve found that the CRMs aren’t always the best at using this information to provide the best insight and that’s why we built QuarterOne. With our new Revenue Bridge feature, you can easily visualize and analyze your revenue changes, helping you unlock the true potential of your SaaS growth at the touch of a button.